
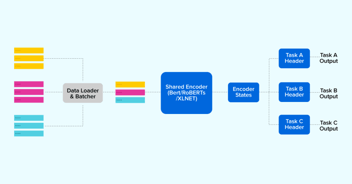
At Haptik, we build new chatbots on a daily basis. These chatbots generate data, lots of it. Data including, but not limited to, what messages were exchanged, what data elements were used by the bot to respond appropriately and what problems were detected along the way. This amounts to huge volumes of data generated daily. Clearly, there is a need to interpret that data into meaningful, insightful analytics.
This necessity led to the development of our very own data-driven analytics tool, an Analytics Dashboard. In this blog, we will talk about the capabilities of our Analytics Dashboard and what went into developing it.
What is a Data-Driven Approach?
Our Analytics Dashboard is a data-driven tool, one focused on information that shows its users the behaviour and patterns created by all their end users. By observing the data constantly, it becomes possible to gain real insights of what works and what does not, what people use and what is ignored, eventually helping us in making really important strategic business decisions.
This dashboard is currently our source of truth, it is the go-to place to analyze and observe exactly what’s transpiring between our end users and all our chatbots.
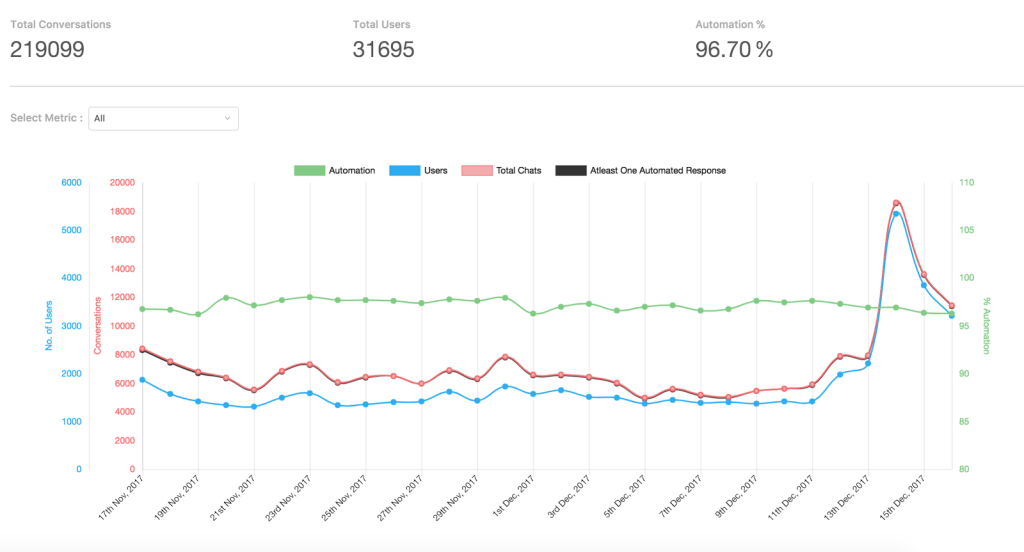
Analytics at a Glance
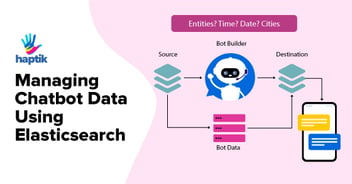
We have a lot of data generated by various parts of our chatbot environment, all pushed to an AWS Kinesis Stream; data from this stream is then pushed to AWS Elasticsearch using Logstash.
The goal of this tool is to make sense of all the data generated by our chatbots across various businesses and clients. Businesses include but are not limited to bots created for our own Haptik App and for external clients. All the data visible inside the tool is filterable based on selected businesses, bots and over a time range.
For Example, we have an entertainment bot, which chats with users, sends across jokes, horoscopes basically spreading happiness. This bot falls under the business of the Haptik app. Now we can see which components of the bot are used most frequently, what new detected keywords are causing the bot to break, what’s working and what’s not for a given time range.
Tech Stack
The main technologies used to create this tool are as follows:
1.Back End: Python Django, our middleware framework of choice.

-
- We use Elasticsearch to store our chat/message/event data across indexes, we perform most of our data crunching at this level.
- ElasticSearch is an open source, a RESTful search engine built on top of Apache Lucene and released under an Apache license. It is Java-based and can search and index document files in diverse formats.
Refer here for Elasticsearch: elastic.co - We do have MySQL, but mainly to fetch user permissions and basic business information.

- Redis is used to make access to static data, optimizations quick.

-
- React Charts Js: https://github.com/reactjs/react-chartjs
- React Graph Js: https://github.com/crubier/react-graph-vis
- Ant as our UI Framework: https://ant.design/docs/react/introduce

If you would like to know why we choose ReactJs for our tools, please refer to the blog.
Overall Architecture
Our overall architecture is MVC based (not including various AWS components):

What Analytics Do We Provide?
Our overall analytics is divided into the following major components:
- Trends
-
- Under Trends we provide aggregated information such as Total conversations, Total users and Overall automation % which basically indicates the success metric of our bots to respond to user queries without human interference
- We also provide a graph which is data aggregations based on time, hourly or daily depending on time range selected, this is a real-time graph.
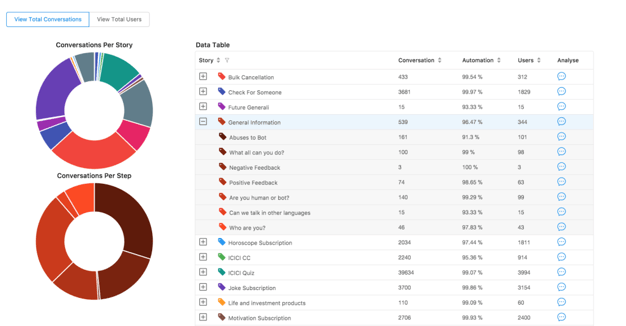
- Story Analysis
-
- Here, we provide information as to which component (story/node) of the chatbot is invoked, how many times, along with the % of success accuracy.
- We also provide a pie chart depicting the same information for better clarity of overall node usage across the bot.
- Selections in the table will re-render the pie charts accordingly.
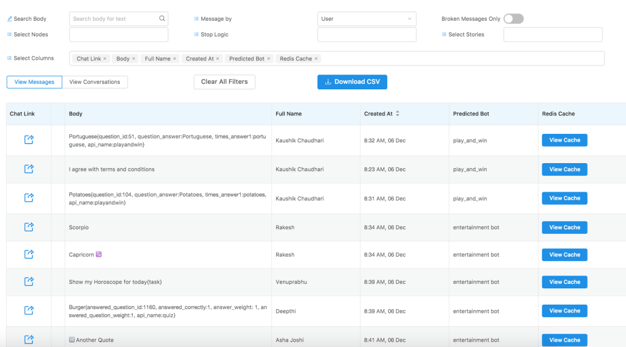
- Message Analysis
- Pretty straightforward, here we provide information about what messages were sent by the user/bot/human as and when they were sent.
- We know everybody loves excel sheets, and this data is downloadable if you have the appropriate permissions
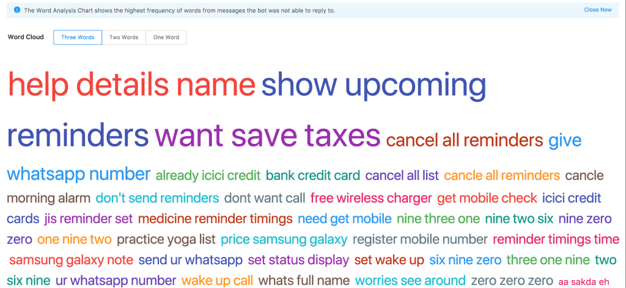
- Word Analysis
-
- We provide a word cloud of all the keywords (important words) that were not understood by the chatbot accurately
- They are ordered and sized with respect to the frequency of occurrence. This is easier to read and more useful as compared to the traditional fancy word clouds. It’s good to be practical sometimes.
- This data helps us to improve the chatbot and increase its understanding so as to reply more accurately next time onwards.
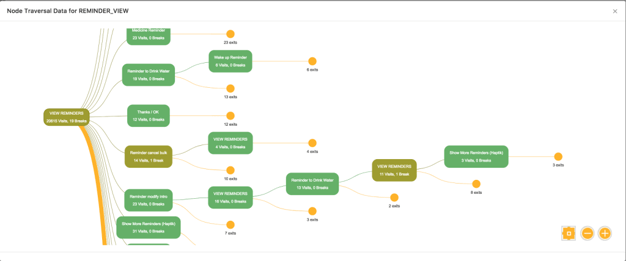
- User Journey
-
- Here we provide the actual mapping of chatbot responses that were required to complete a conversation. This shows us how often certain nodes are invoked, and wherein the chat flow they most commonly appear.
- This mainly helps us to improve the chatbot at a conversation level.
What Did We Learn From This?
- Elasticsearch is perfect for data which does not get manipulated. Sure, it’s a little expensive when it comes to memory utilization, but its beauty lies in its extremely optimized built-in ability to crunch data over multiple levels of aggregations. (similar to ‘group by’ as provided by MySQL)
- To compare, we initially used Python’s pandas to crunch our data, it took around 24 seconds for the API to complete as compared to 1.2 seconds when the crunching was leveraged to Elasticsearch, enough said.
- ReactJs has tremendous support and a ton of libraries to choose from, and it’s constantly upgrading to provide extremely useful features. It also allows for an extremely efficient Test Driven Development approach.
We will continue to experiment with more technologies out there and make this tool even better as a benchmark for Analytics Tools. Do let us know if you have any feedback in the comment section below; we will be happy to know.
Haptik is hiring. Do visit our careers section and get in touch with us at hello@haptik.ai.


.webp?width=352&name=Charles-Proxy%20(1).webp)


source on Google