

Introduction
Web SDK (chatbot interface) is our client-facing Application. Therefore, it is of utmost importance to make sure that this piece of software is efficient. Part of the reason is that it’s an added resource for our client’s website. Additionally, a slow chatbot may cause the entire website to lag, which in turn can cause severe drop-offs.
“Performance is our hidden feature” - Evan Wallace, CTO@Figma
The above statement is true, and we’ve seen throughout software history that non-performant applications have even caused businesses to shut down.
Therefore, our goal is to provide the best possible AI assistant without compromising the user experience (UX).
In the last few months, we doubled down to improve the performance of the chatbot, and this article is solely dedicated to sharing the learnings we had throughout the journey.
Let’s first look at the areas of performance improvement for any application.
Areas of Performance Improvement
There are 4 main categories that affect performance:
Bundle / Static asset size: The static resource of an application, like the code files (Javascript/CSS/Html), images, configuration files, etc, contributes to the entire bundle size. The larger the bundle size, the slower it will be to load the entire app over the network.
API response size & time: Getting dynamic data from a server is essential to build any application. However, over fetching of data puts undue load on the network, thus affecting the response time. Moreover, the complexity of how this data is calculated on the server-side increases the latency.
Good Code: For example, doing an early return from a function, breaking a loop early, or reducing unnecessary tertiary variables can save a lot of CPU cycles, thus improving the performance of the overall code.
Caching: Caching plays a vital role in making the application faster if similar resources are fetched multiple times. Both server-side & client-side caching are essential to make a fast & responsive application.
For our chatbot, we were clocking around 750 KBs for our production compressed build. This is not acceptable given it will appear as part of the Client’s website. Therefore, we focused on Bundle size optimization. To even start with we needed a baseline. So we opted for GT-Metrix, which uses lighthouse metrics to gauge the performance of any web application.
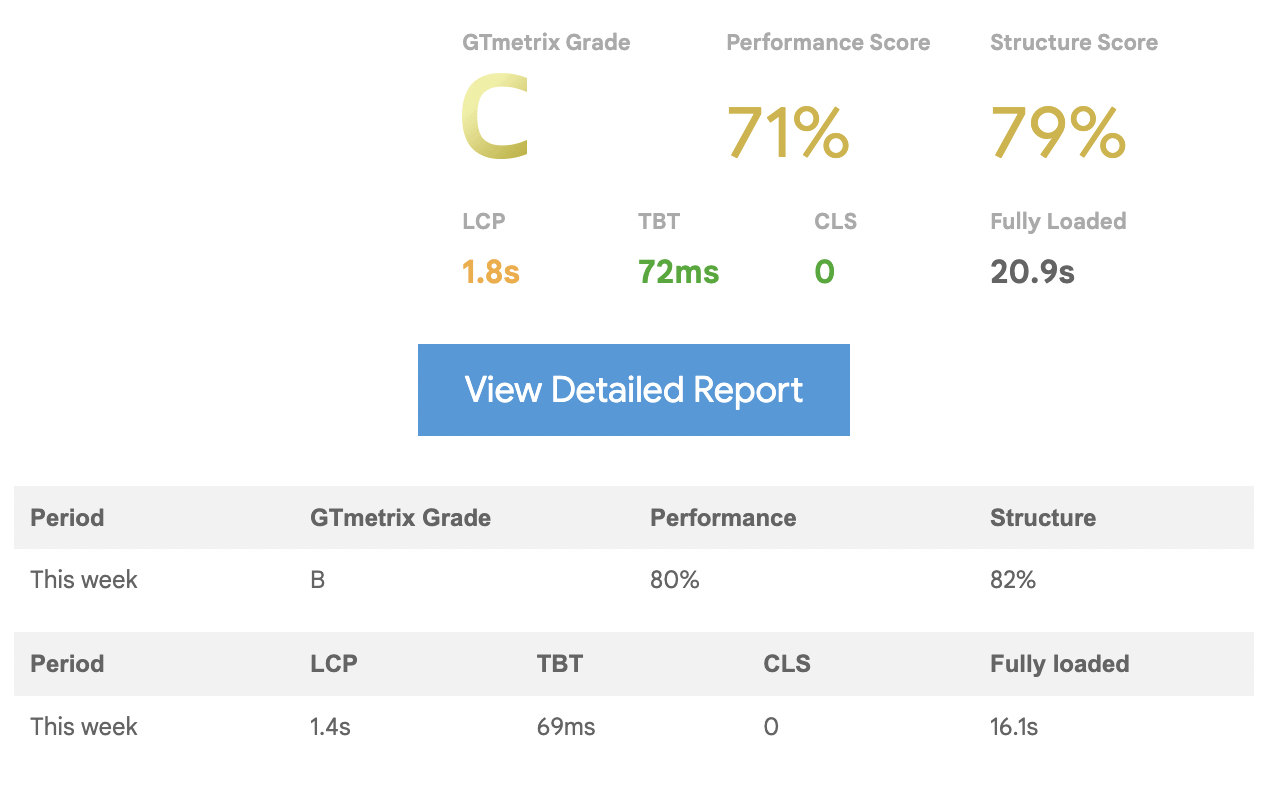
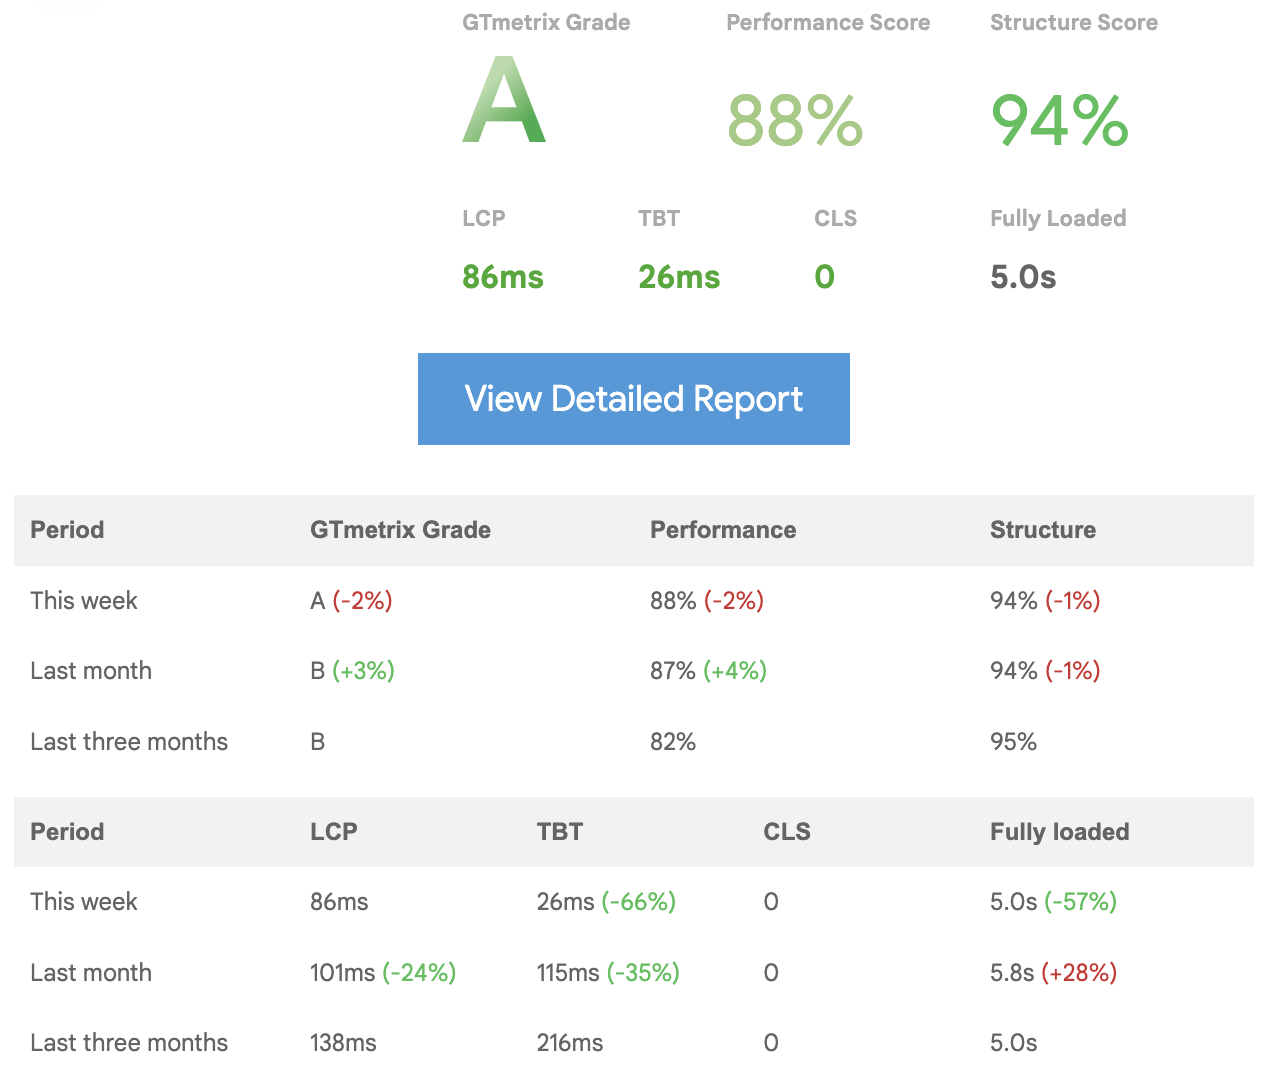
GTMetrix Report: Before the improvement
Below is the Performance report for our XDK before our improvement exercise. We scored a “C”. Before we jump in as to how we made this grade go up to “A”, let’s talk about the metric itself.
What are Lighthouse Metrics?
Gtmetrix internally uses Lighthouse to gauge the performance. The grading happens based on multiple factors. Below is the weightage of each metric.
Metric Weightage
| Metric | Weight |
| First Contentful Paint | 10% |
| Speed Index | 10% |
| Largest Contentful Paint | 25% |
| Time To Interactive | 10% |
| Total Blocking Time | 30% |
| Cumulative Layout Shift | 15% |
The largest Contentful paint & Total blocking time makes up 55% of the entire weightage, which means if we improve on these two metrics, the overall grade will also improve. Let’s see what these metrics mean. -
First Contentful Paint
FCP measures how long it takes the browser to render the first piece of DOM content after a user navigates to your page. Images, non-white <canvas> elements, and SVGs on your page are considered DOM content; anything inside an iframe isn't included.
Speed Index
Speed Index measures how quickly content is visually displayed during page load. Lighthouse first captures a video of the page loading in the browser and computes the visual progression between frames. Lighthouse then uses the Speedline Node.js module to generate the Speed Index score.
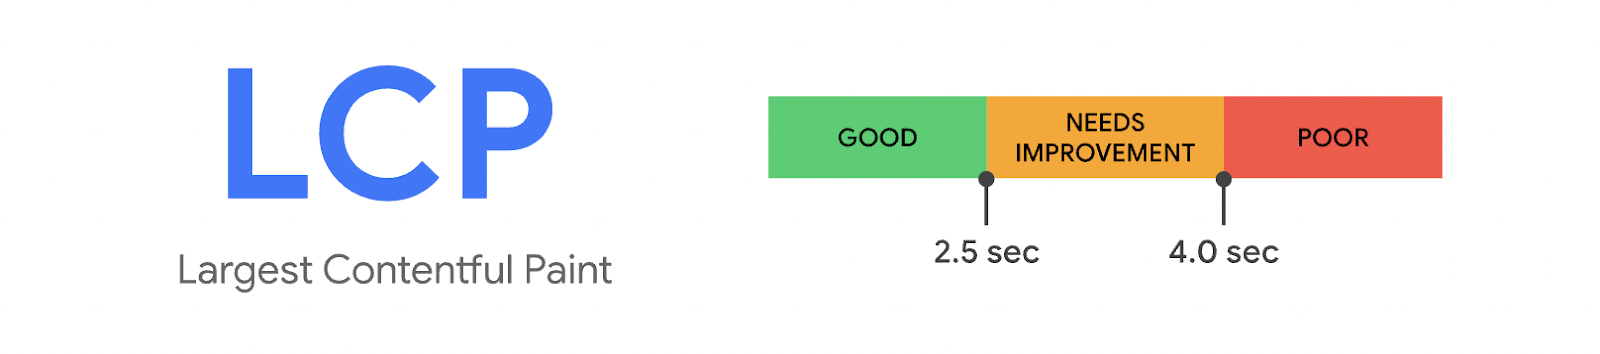
Largest Contentful Paint
The Largest Contentful Paint (LCP) metric reports the render time of the largest image or text block visible within the viewport, relative to when the page first started loading.
Time to be Interactive
TTI measures how long it takes a page to become fully interactive.
- The page displays useful content, which is measured by the First Contentful Paint,
- Event handlers are registered for the most visible page elements, and
- The page responds to user interactions within 50 milliseconds.
Total Blocking Time
Total Blocking Time (TBT) is one of the metrics tracked in the Performance section of the Lighthouse report. Each metric captures some aspect of page load speed.
Scale for TBT
| TBT Time (in milliseconds) | Color-coding |
| 0-200 | Green (fast) |
| 200-600 | Orange (moderate) |
| Over 600 | Red (slow) |
Cumulative Layout Shift - (UX)
Unexpected movement of page content usually happens because resources are loaded asynchronously or DOM elements get dynamically added to the page above existing content. The culprit might be an image or video with unknown dimensions, a font that renders larger or smaller than its fallback, or a third-party ad or widget that dynamically resizes itself.
Baseline & our performance budget
Now that we know what each of the above metrics means, putting a threshold number (budget) for each of these metrics will help us measure the success (a gain from the current numbers or the baseline). For XDK we budgeted for 400KB for the bundle size at the initial round of improvement exercises.
Things we did & our learnings
Removing duplicate dependencies
Duplicate dependencies are a common occurrence when you use 3rd party libraries. This causes a particular dependency to be bundled more times than necessary.

Thankfully, Webpack allows a way to make a pool of common dependency chunks (with the help of cacheGroups), that can be referred to by others.
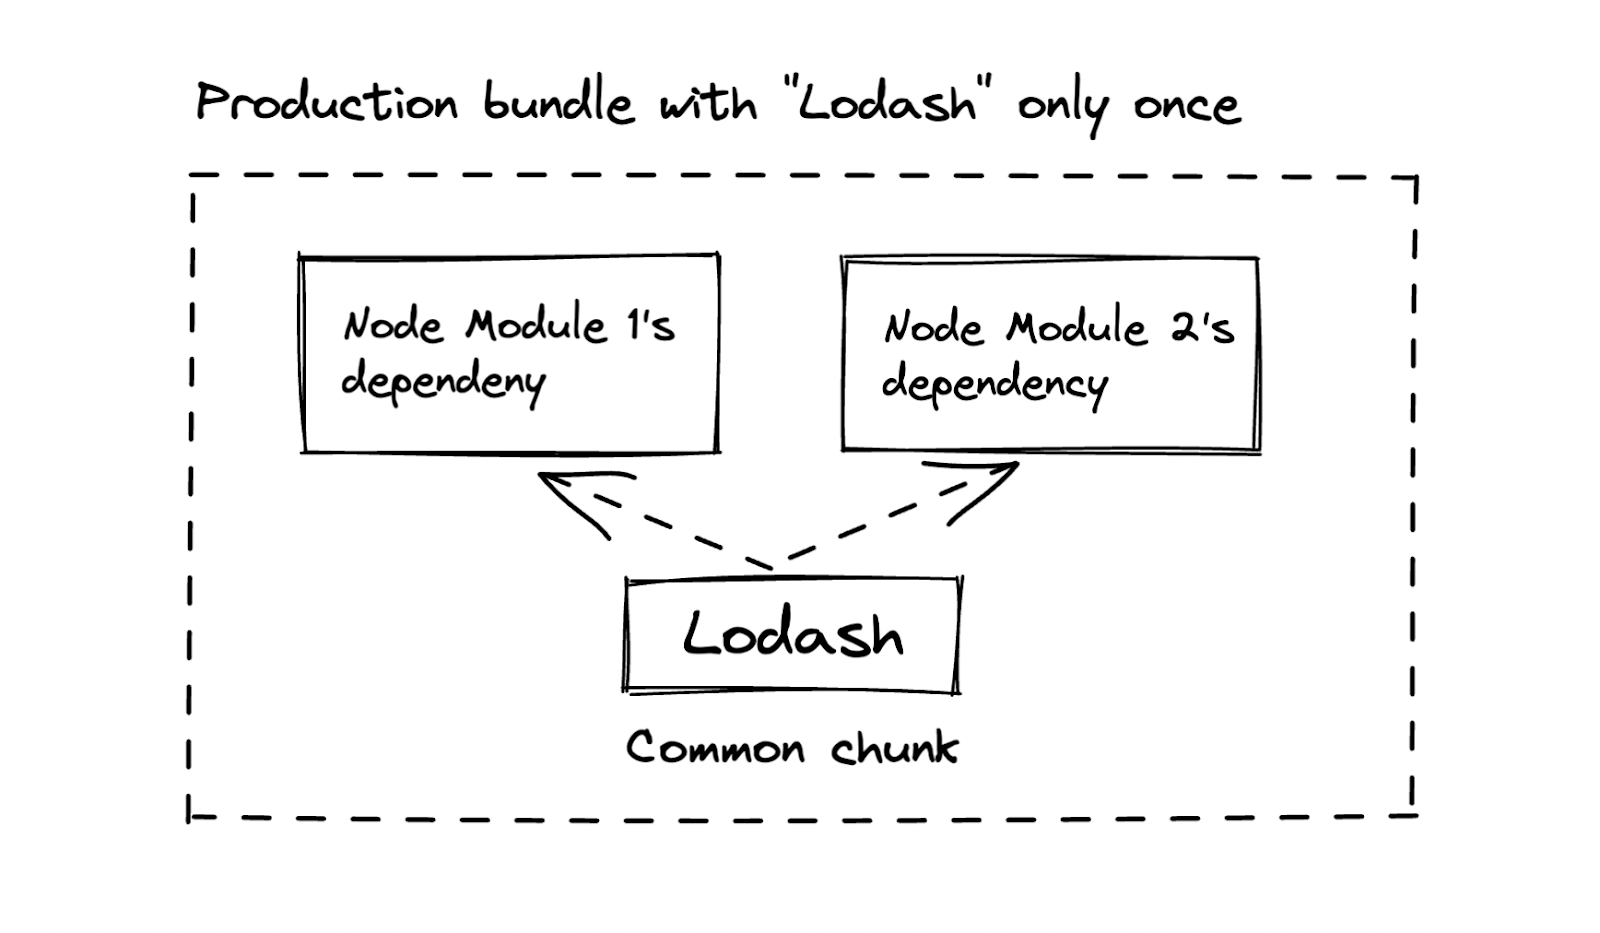
Here is the Webpack config to achieve the above illustration:
// Webpack config
module.exports = {
    optimization: {
        splitChunks: {
          cacheGroups: {
            commons: {
                test: /[\\/]node_modules[\\/]((?!react).*)[\\/]/,
                name: 'commons',
                chunks: 'all'
                },
            }
        }
    }
}
Removing duplicate assets
Duplicate assets may appear if you have older versions of components or images/SVGs lying around and still being imported. So we removed such components and SVGs, which saved us a few kilobytes.
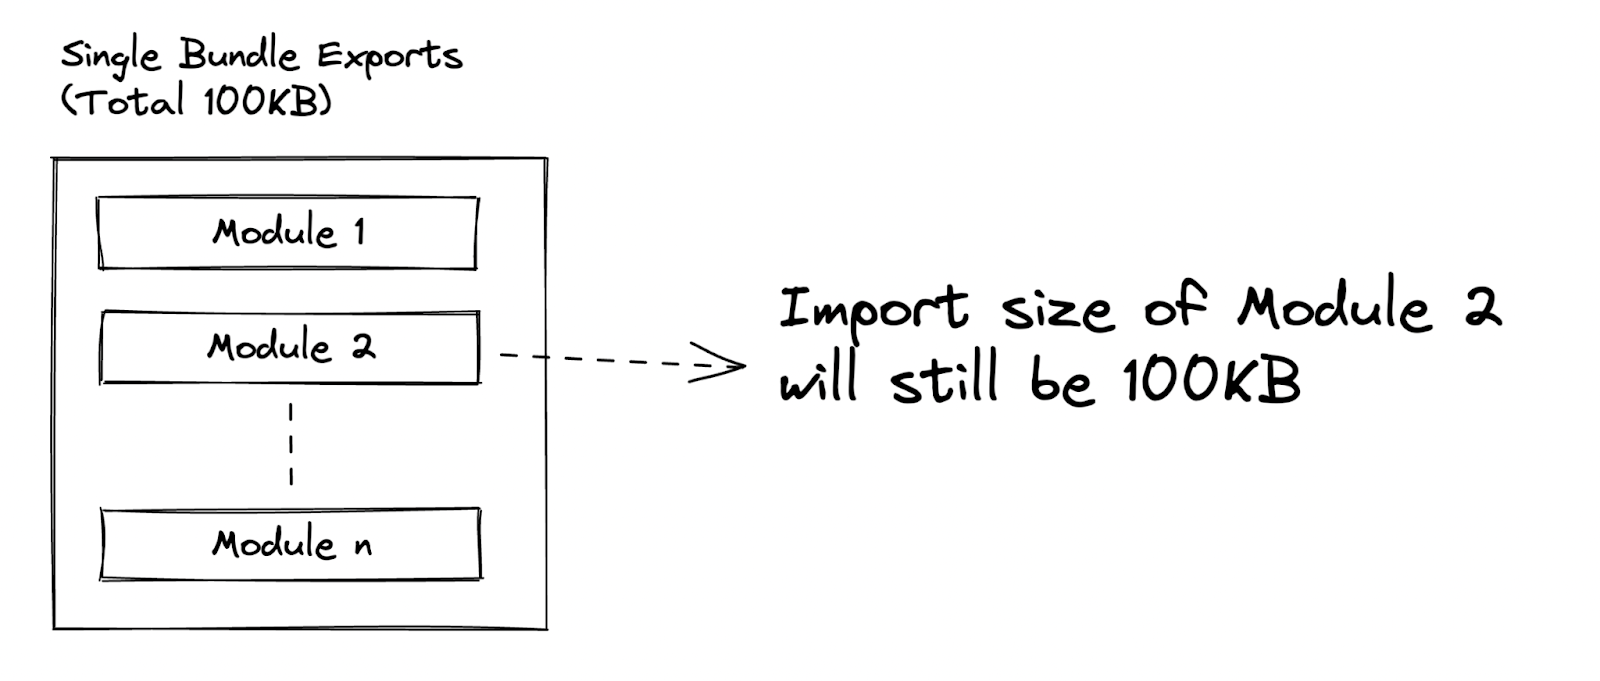
Named export
Our internal component library has a single export point. It causes the entire library to be added, even if a single component is imported. Splitting the exports as per the Component name, helped us reduce the import cost. Let’s see how it looks visually.

Here is a comparison in Code -
/* Bad practice - Don't do it */
// index.js
export { default as Provider } from './Provider';
export { default as Dropdown } from './Dropdown';
export { default as ChatElement } from './ChatElement';
export { default as Actionable } from './Actionable';
export { default as Modal } from './Modal';
export { default as LocationPicker } from './LocationPicker';

// rollup.config.js
export default {
  input : { index: "src/index.js" }
}
/* Good practice - Recommended */
// chunkExports.js
export default {
  provider: "src/containers/Provider/Provider.js",
  dropdown: "src/modals/Dropdown/index.js",
  chatElement: "src/containers/ChatElement/index.js",
  actionable: "src/classes/Actionable.js",
  modal: "src/modals/_components/Modal.js",
  locationPicker: "src/modals/LocationPicker/index.js"
};

// rollup.config.js
export default {
  input: { ...chunkExports },
  ...
}
// rollup.config.js
export default {
input: { ...chunkExports },
...
}
Move offline data to the server
We have had static data committed to the code base. This usually happens when we push an experimental feature and do not want a server overhead. But with time, as the requirement grows, the size of such static data also increases.
One such feature is Language Specific translation of Chatbot UI. A user can select a language manually or based on their geolocation a default regional language is set. These static translations take up around 5KB for each language. And with support for 100+languages, we were clocking around 160 KB in excess in our production bundle. This number grew with the addition of more languages. Hence we had to move the entire data set to the backend. Thus saving us a lot on the bundle size.
Code split based on visual appearance
Code splitting is a great way to only serve static JS files whenever necessary thus saving a lot of bandwidth for the user. But, it has to be done based on the visual appearance of those elements on the screens instead of their logical cohesion.

However, we end up with a logical cohesion of the above implementation, like shown below in the code example. Here, we unknowingly end up bundling the code for LetsChat and ChatExtendedView in a single file.
/* Not recommended */
import LetsChat from './LetsChat.js';
import ChatExtendedView from './ChatExtendedView.js';

function ChatUI({ active }) {
	...
	return (<div>
    <ChatExtendedView active={active}/>
		<LetsChat/>
	</div>)
	...
}
Therefore, we should be lazy-loading the components like so.
...
// lazy load
const ChatExtendedView = React.lazy(() => import('./ChatExtendedView'));

// Render the lazy loaded component
    return (
        <React.Suspense fallback={null}>
          <PromptWrapper active={isActive}
						{...props}
          />
        </React.Suspense>
    );
...
But there is a catch. The above code does split the files. However, they will load at the same time because we never prevented it from loading. To solve this, we prevented the code from being injected during the initial load with the help of a boolean flag. Here is a sample implementation -
...
// lazy loadconst
const ChatExtendedView = React.lazy(() => import('./ChatExtendedView'));

// Load lazy-loaded components when the active flag evaluates truthy
    return (
      isActive && (
        <React.Suspense fallback={null}>
          <ChatExtendedView
						{...props}
          />
        </React.Suspense>
      )
    );
...
The video below shows how the JS file loads only when the user interacts with the Chatbot.
What were the outcomes?
With all the above changes, we were successful to achieve an “A”.
We’re not done yet.
After all the work done above, there is still a fair bit of work left to be done on the API side. As you can see from the below waterfall chart, that few APIs take longer to respond. Here the server response is essential for conditional renders, thus affecting the overall loading time of our application.
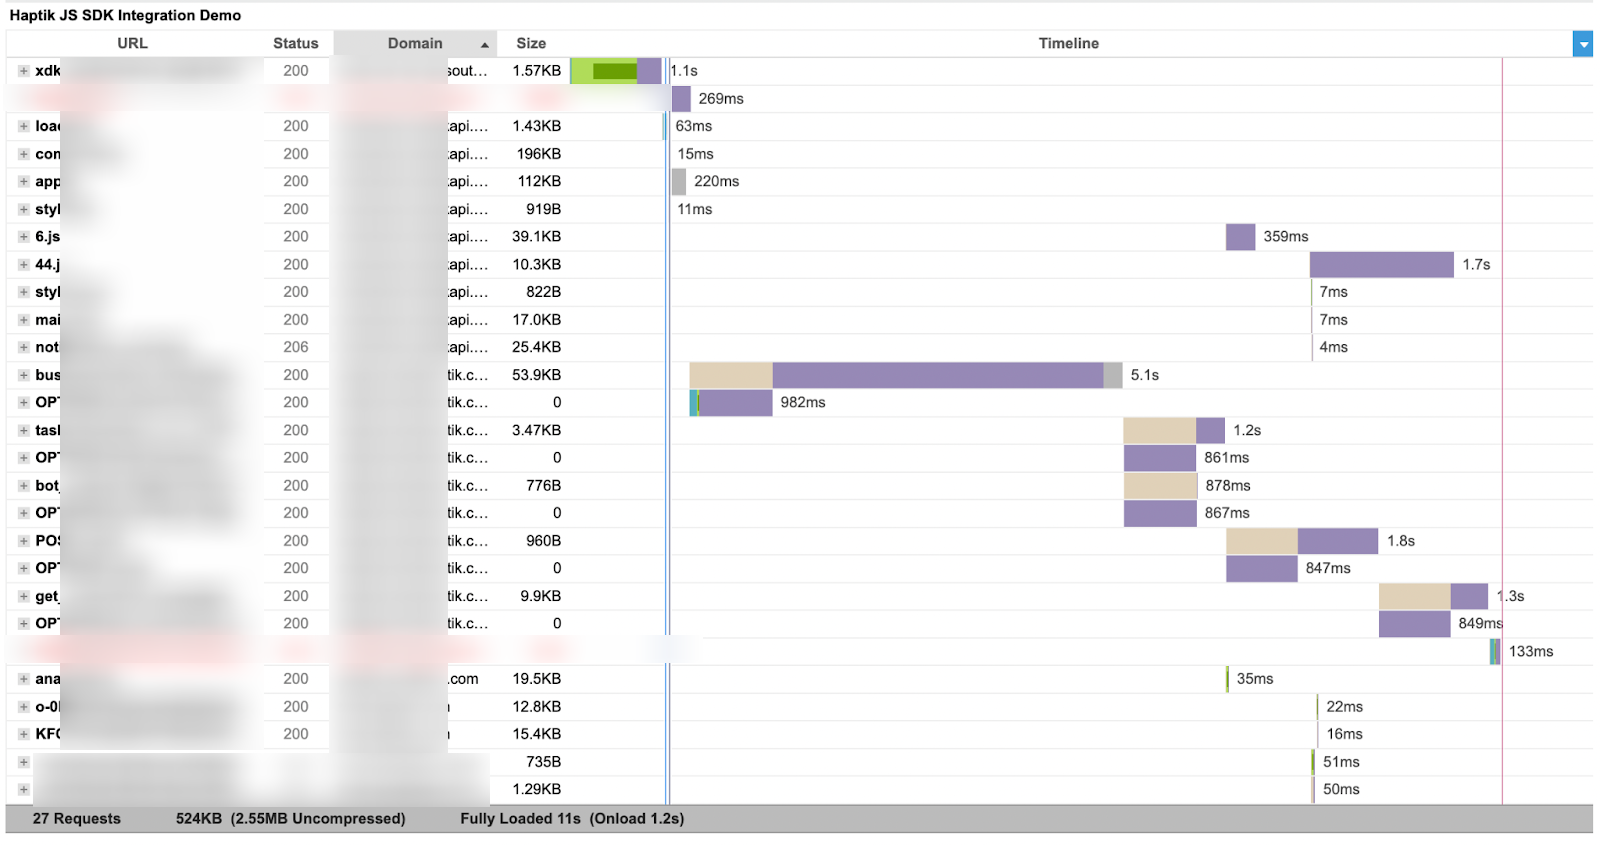
With API optimization, which is our next task, our Chatbot will become blazingly fast!
Summary
There are many ways to improve the performance of an application. However, the call has to be taken based on data. Monitoring performance metrics via tools like GTMetrics, Lighthouse, and React-profiler helped us see the bigger picture. This directed us to focus on the right areas and make the right performance budget.


.webp?width=352&name=Charles-Proxy%20(1).webp)


source on Google