
In an organization where microservice architecture is followed or even if their applications work in a distributed manner, it is complicated to debug or troubleshoot something, especially when there is a lack of visibility. Logs are the best friend in many of these situations.
Even if we do all the logging necessary, distributed systems/regions make it a challenge to identify & mitigate the root cause of any issue. One of the best ways to overcome this is to ship these logs to a centralized data store & surf through it whenever needed or alert on specific log entries.
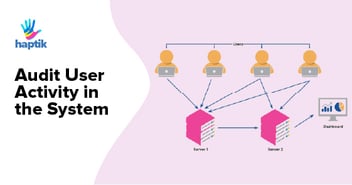
Now, in a vast system where a high volume of logs is spawned, it again becomes a challenge to maintain availability, scalability & reliability along with visibility in a secure way. For instance, this was our architecture before we moved to a centralized logging and alerting system.
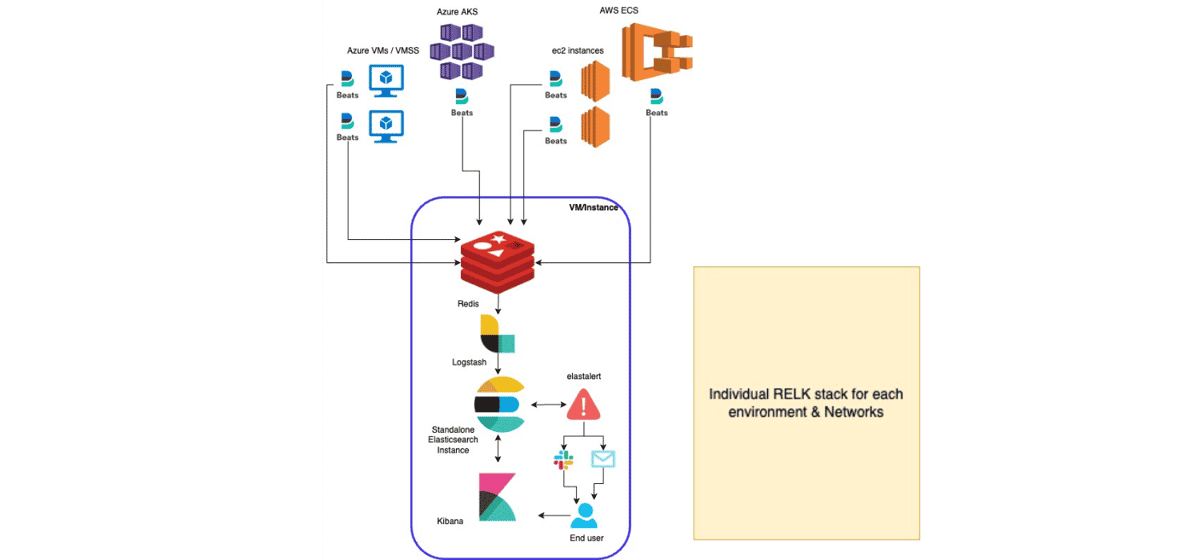
All different deployments had a separate RELK stack and engineers had to go to 10-12 Kibana dashboards to view data. This also had overheads of maintaining & securing multiple components for each region, environment & network.
Let me quickly describe the components involved in this architecture and that should give you an idea of why this was operationally not the best.
Filebeat -
To collect & ship logs to a standalone Redis hosted in a VM/Instance in the same network.
Problems: Aggressive logging results in a resource crunch resulting in delayed shipping.
Redis -
Acted as a buffer, where data published by filebeat was getting consumed by logstash container running in the same VM/instance.
Problems: Logstash failing to consume data results in a memory crunch & weak security due to the nature of Redis.
Logstash -
ETL (Extract, Transform & Load) tool hosted on the same VM/Instance as Redis, which consumes data from Redis, performs transformations on data & loads it to a standalone elasticsearch.
Problems: Due to distributed architecture, operational overhead to maintain it for each region, environment & network.
Elasticsearch & Kibana:
Elasticsearch has the data store and kibana to visualize & surf through the data pushed by Logstash to Elasticsearch.
Problems: Again same as logstash - Maintenance overhead due to distributed architecture & needed vertical scaling since this was hosted as a standalone container on the same VM as Redis & Logstash.
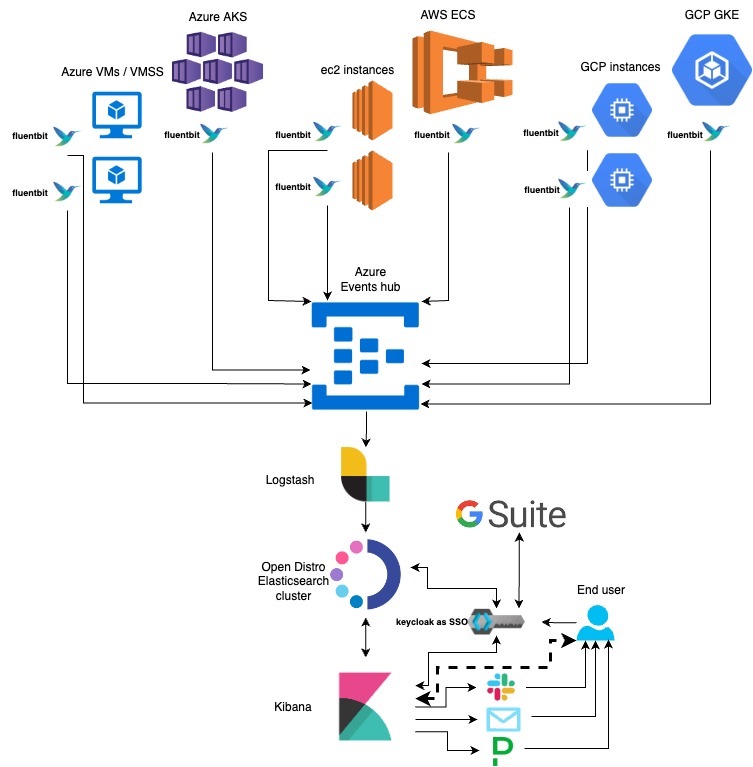
Now let's understand the “how” part - How did we fix problems at scale for 100s of GBs of daily logs.
Let's start by understanding the components involved here.
Fluentbit:
Highly scalable, fast & lightweight log shipper
Azure Event Hubs:
Centralized event buffer - used to hold data from across all projects & environments centrally for a small amount of time without any maintenance overhead
Logstash -
ETL (Extract, Transform & Load) tool hosted centrally in a VM/Instance which extracts data from Azure Events Hub, Performs transformation on data & loads it to Open Distro Elasticsearch
Open Distro Elasticsearch:
Highly scalable clustered setup to centrally store data.
Kibana:
Data visualization & alerting
Keycloak:
Acts as Single-Sign-On (SSO) along with identity & access management
The first part of designing the central logging & alerting system is categorizing logs in our application by adding loggers & the second part is shipping it to the data store. From the application, we write logs to a file where the filename later becomes a type of log, where we extend our handlers & loggers as per our needs.
Below is a skeleton of a logger that we add to our application:
import structlog
LOG_LEVEL = os.environ.get('DJANGO_LOG_LEVEL', 'error').upper()
LOGGING = {
    'version': 1,
    'disable_existing_loggers': False,
    'filters': {
        'require_debug_false': {
            '()': 'django.utils.log.RequireDebugFalse'
        }
    },
    'formatters': {
        'time_log': {
            'format': '%(levelname)s %(asctime)s %(module)s %(message)s'
        },
        'better_log': {
            'format': '\033[35m[%(asctime)s %(module)s %(lineno)d]\033[0m %(message)s'
        },
        'json_formatter': {
            '()': structlog.stdlib.ProcessorFormatter,
            'processor': structlog.processors.JSONRenderer(),
            'foreign_pre_chain': FOREIGN_PRE_CHAIN_PROCESSORS,
        },
        'colored': {
            '()': structlog.stdlib.ProcessorFormatter,
            'processor': structlog.dev.ConsoleRenderer(colors=True),
            'foreign_pre_chain': FOREIGN_PRE_CHAIN_PROCESSORS,
        },
        'key_value': {
            '()': structlog.stdlib.ProcessorFormatter,
            'processor': structlog.processors.KeyValueRenderer(key_order=['timestamp', 'level', 'event', 'logger']),
            'foreign_pre_chain': FOREIGN_PRE_CHAIN_PROCESSORS,
        }
    },
    'handlers': {
        'abc': {
            'level': LOG_LEVEL,
            'class': 'logging.handlers.WatchedFileHandler',
            'filename': os.path.join(SITE_ROOT + '/logs/abc.log'),
            'formatter': 'json_formatter'
        }
    },
    'loggers': {
        'abc': {
            'handlers': ['abc'],
            'level': 'ERROR',
            'propagate': False,
        },
    }
}
These loggers are part of all of our microservices no matter where we run our codebase, so these are version controlled as well. A unique identifier is maintained for each microservice , application & type of log which makes it even easier to track a log across all of our environments.
A separate volume is maintained in each node which is mounted to both application containers & log shipper daemon which is fluentbit.
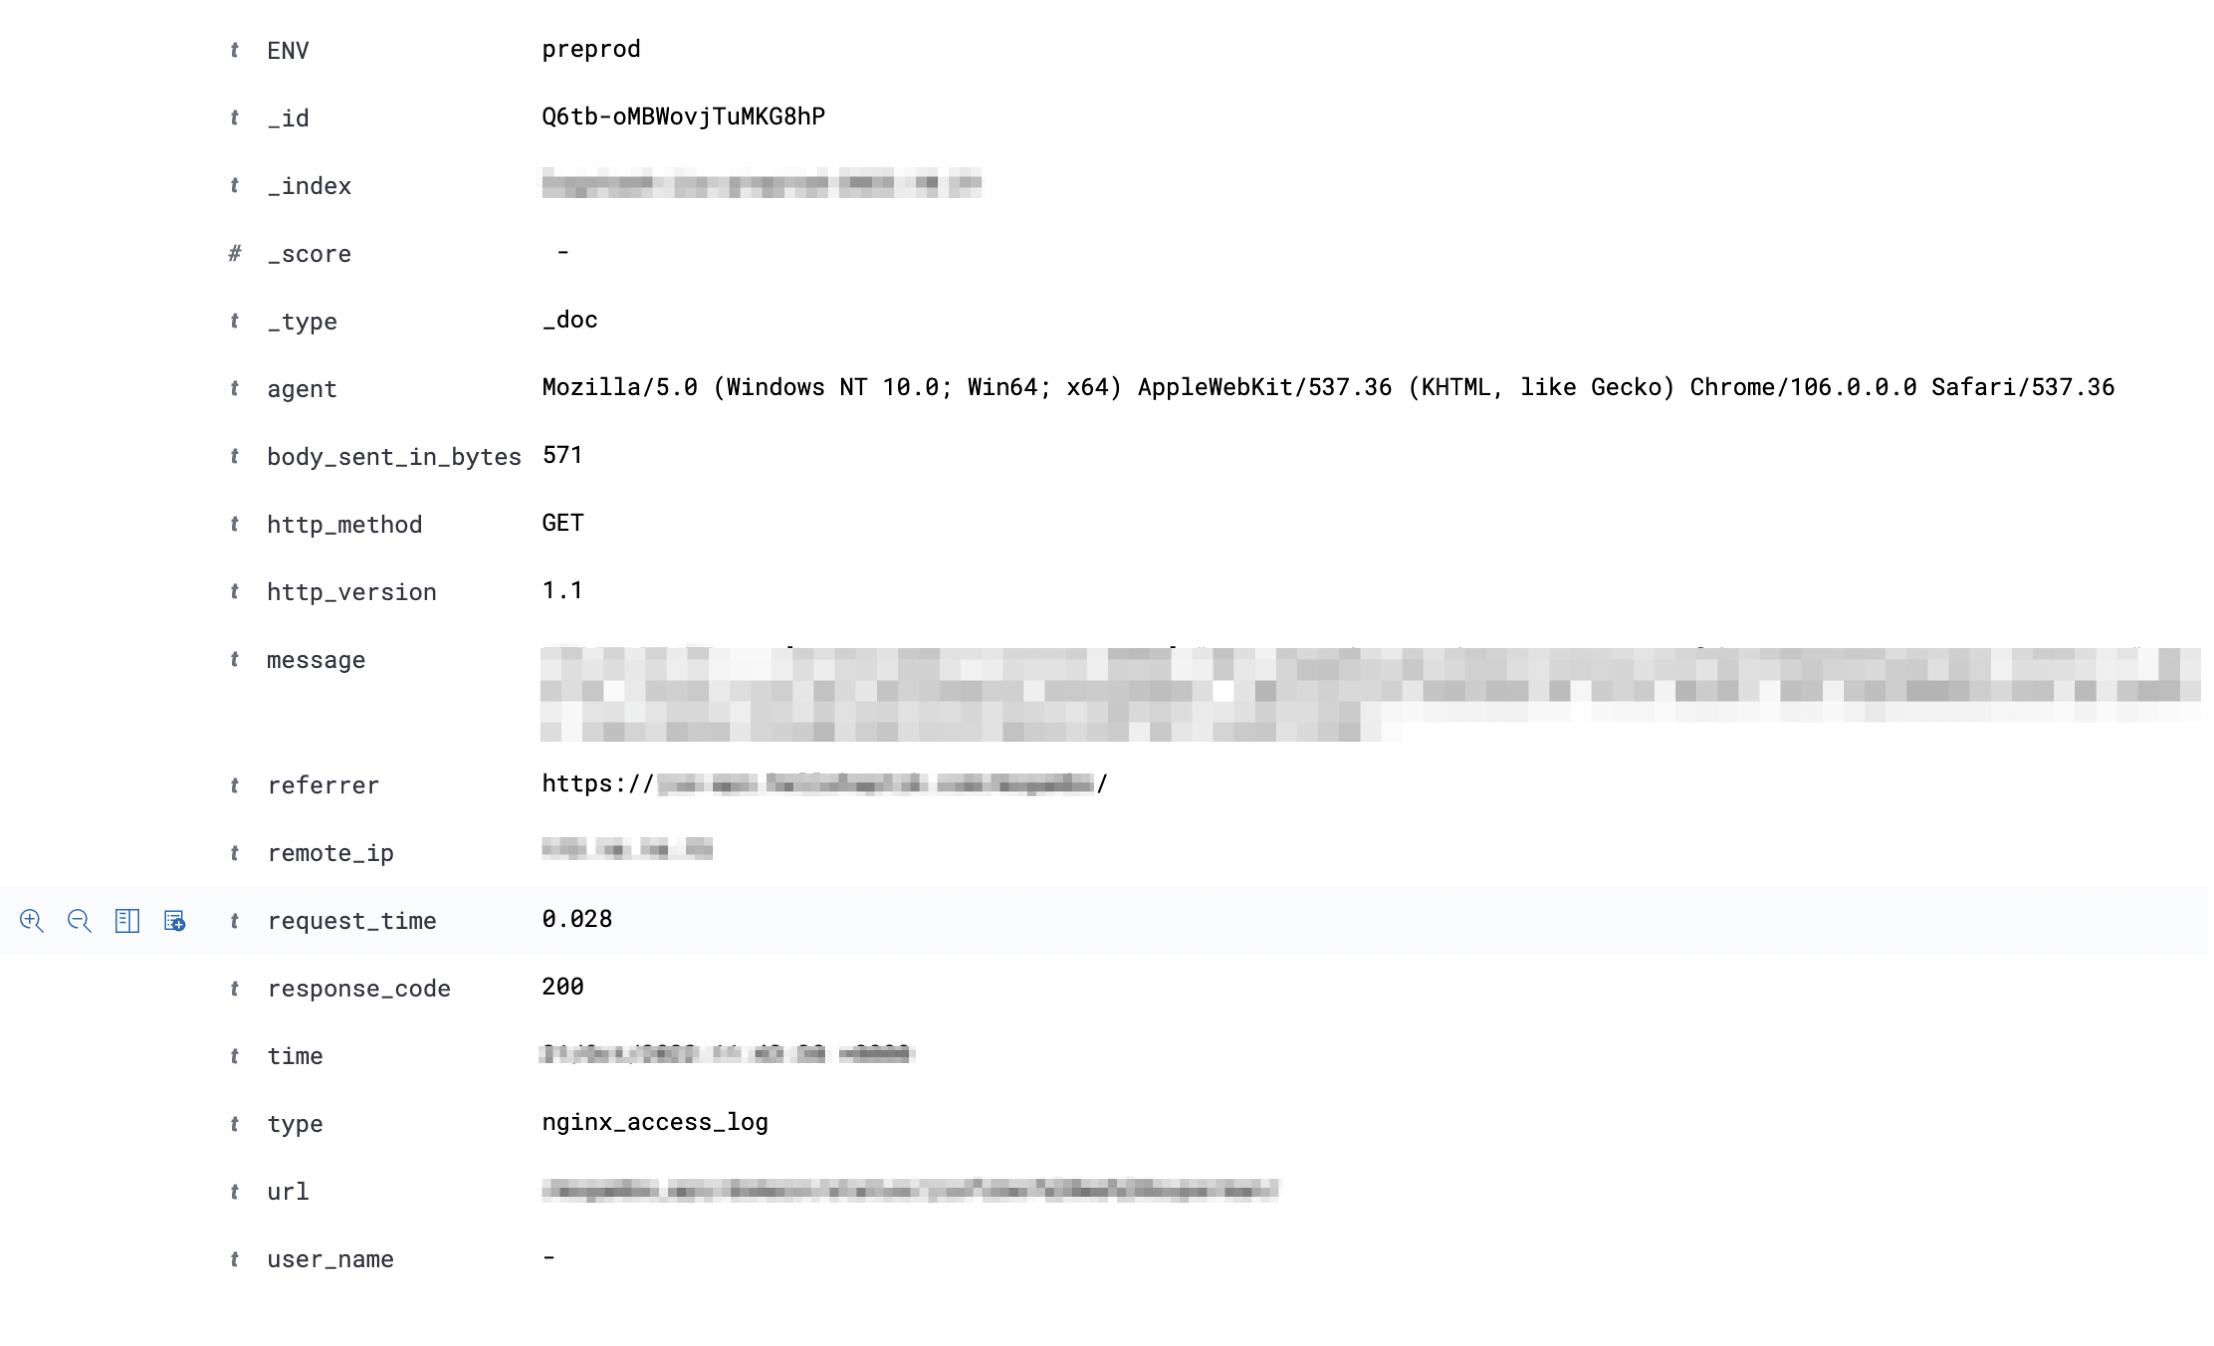
Loggers from our code write logs to files in a mounted persistent volume. Since the same volume is mounted in the log shipper app as well, using its tail input plugin fluentbit now reads the file. It then picks a few environment variables like application name, and operating environment (production/staging) & adds them as a key-value pair along with each log line.
These lines are sent to the Azure event hub using fluentbit’s Kafka output plugin by fetching connection string from Kubernetes sectors or respective secrets manager.
Note: Fluentbit image with custom configuration is maintained in a private container image registry.
Sample fluentbit configuration.
[SERVICE]
    flush                               1
    log_Level                           info
    storage.path                      	/opt/logs/fluent/chunks/
    storage.sync                      	normal
    storage.checksum                  	off
    storage.backlog.mem_limit         	100M
    HTTP_Server                       	On
    HTTP_Listen                       	0.0.0.0
    HTTP_PORT                         	2020
[INPUT]
    Name                              	tail
    storage.type                      	filesystem
    Path                              	/opt/logs/*.log
    DB                                	/opt/logs/fluent-bit-input.db
    Buffer_Chunk_Size                 	5MB
    Buffer_Max_Size                   	10MB
    Mem_Buf_Limit                     	25MB
    Refresh_Interval                  	5
    Path_Key                          	filename
    Ignore_Older                      	5h
    Skip_Empty_Lines                  	On
    Skip_Long_Lines                   	On
[FILTER]
    Name                              		record_modifier
    Match                             		*
    Record                            		topic ${topic}
    Record                            		ENV ${ENVIRONMENT}
    Record                            		APP ${APP}
[OUTPUT]
    Name                              	kafka
    Match                             	*
    Brokers                           	${EH_ENDPOINT}:9093
    Topics                            	${topic}
    queue_full_retries                	50
    storage.type                      	filesystem
    rdkafka.message.send.max.retries    20
    rdkafka.socket.keepalive.enable   	true
    rdkafka.metadata.max.age.ms       	180000
    rdkafka.request.timeout.ms        	60000
    rdkafka.reconnect.backoff.ms      	200
    rdkafka.enable.idempotence        	true
    rdkafka.security.protocol         	SASL_SSL
    rdkafka.sasl.mechanism            	PLAIN
    rdkafka.sasl.username             	$ConnectionString
    rdkafka.sasl.password             	${EH_CONN_LOGLAKE}
    rdkafka.request.required.acks     	-1
Sample fluent bit daemonset.
---
apiVersion: apps/v1
kind: DaemonSet
metadata:
  name: fluentbit
  namespace: logs
  labels:
    k8s-app: loglake
spec:
  selector:
    matchLabels:
      k8s-app: loglake
  template:
    metadata:
      labels:
        k8s-app: loglake
    spec:
      serviceAccountName: fluentbit
      terminationGracePeriodSeconds: 30
      containers:
      - name: fluentbit
        image: "<container_image_registory>/fluentbit:fluent-bit-eventshub"
        imagePullPolicy: Always
        env:
        - name: APP
          valueFrom:
            secretKeyRef:
              name: fluentbit-env
              key: APP
        - name: topic
          valueFrom:
            secretKeyRef:
              name: fluentbit-env
              key: topic
        - name: ENVIRONMENT
          valueFrom:
            secretKeyRef:
              name: fluentbit-env
              key: ENVIRONMENT
        - name: EH_CONN_LOGLAKE
          valueFrom:
            secretKeyRef:
              name: fluentbit-env
              key: EH_CONN_LOGLAKE
        - name: EH_ENDPOINT
          valueFrom:
            secretKeyRef:
              name: fluentbit-env
              key: EH_ENDPOINT
        securityContext:
          runAsUser: 0
        resources:
          limits:
            memory: 200Mi
          requests:
            memory: 100Mi
        volumeMounts:
        - name: fluentbit-config
          mountPath: "/opt/logs"

      volumes:
      - name: fluentbit-config
        hostPath:
          path: /opt/logs
---
# ClusterRoleBinding
apiVersion: rbac.authorization.k8s.io/v1
kind: ClusterRoleBinding
metadata:
  name: fluentbit
subjects:
- kind: ServiceAccount
  namespace: logs
  name: fluentbit
roleRef:
  kind: ClusterRole
  name: fluentbit
  apiGroup: rbac.authorization.k8s.io
---
# ClusterRole
apiVersion: rbac.authorization.k8s.io/v1
kind: ClusterRole
metadata:
  name: fluentbit
  labels:
    k8s-app: loglake
rules:
- apiGroups: [""] # "" indicates the core API group
  resources:
  - namespaces
  - pods
  verbs:
  - get
  - watch
  - list
---
# ServiceAccount
apiVersion: v1
kind: ServiceAccount
metadata:
  name: fluentbit
  namespace: logs
  labels:
    k8s-app: loglake
---
This data is consumed by logstash & ingested to the Open Distro elasticsearch cluster which contains multiple ingestion nodes, data nodes & 3 master nodes. Open Distro Kibana is used to search, visualize & alert on this data.
End user management is achieved using Single sign-on with Keycloak & Google Suite.
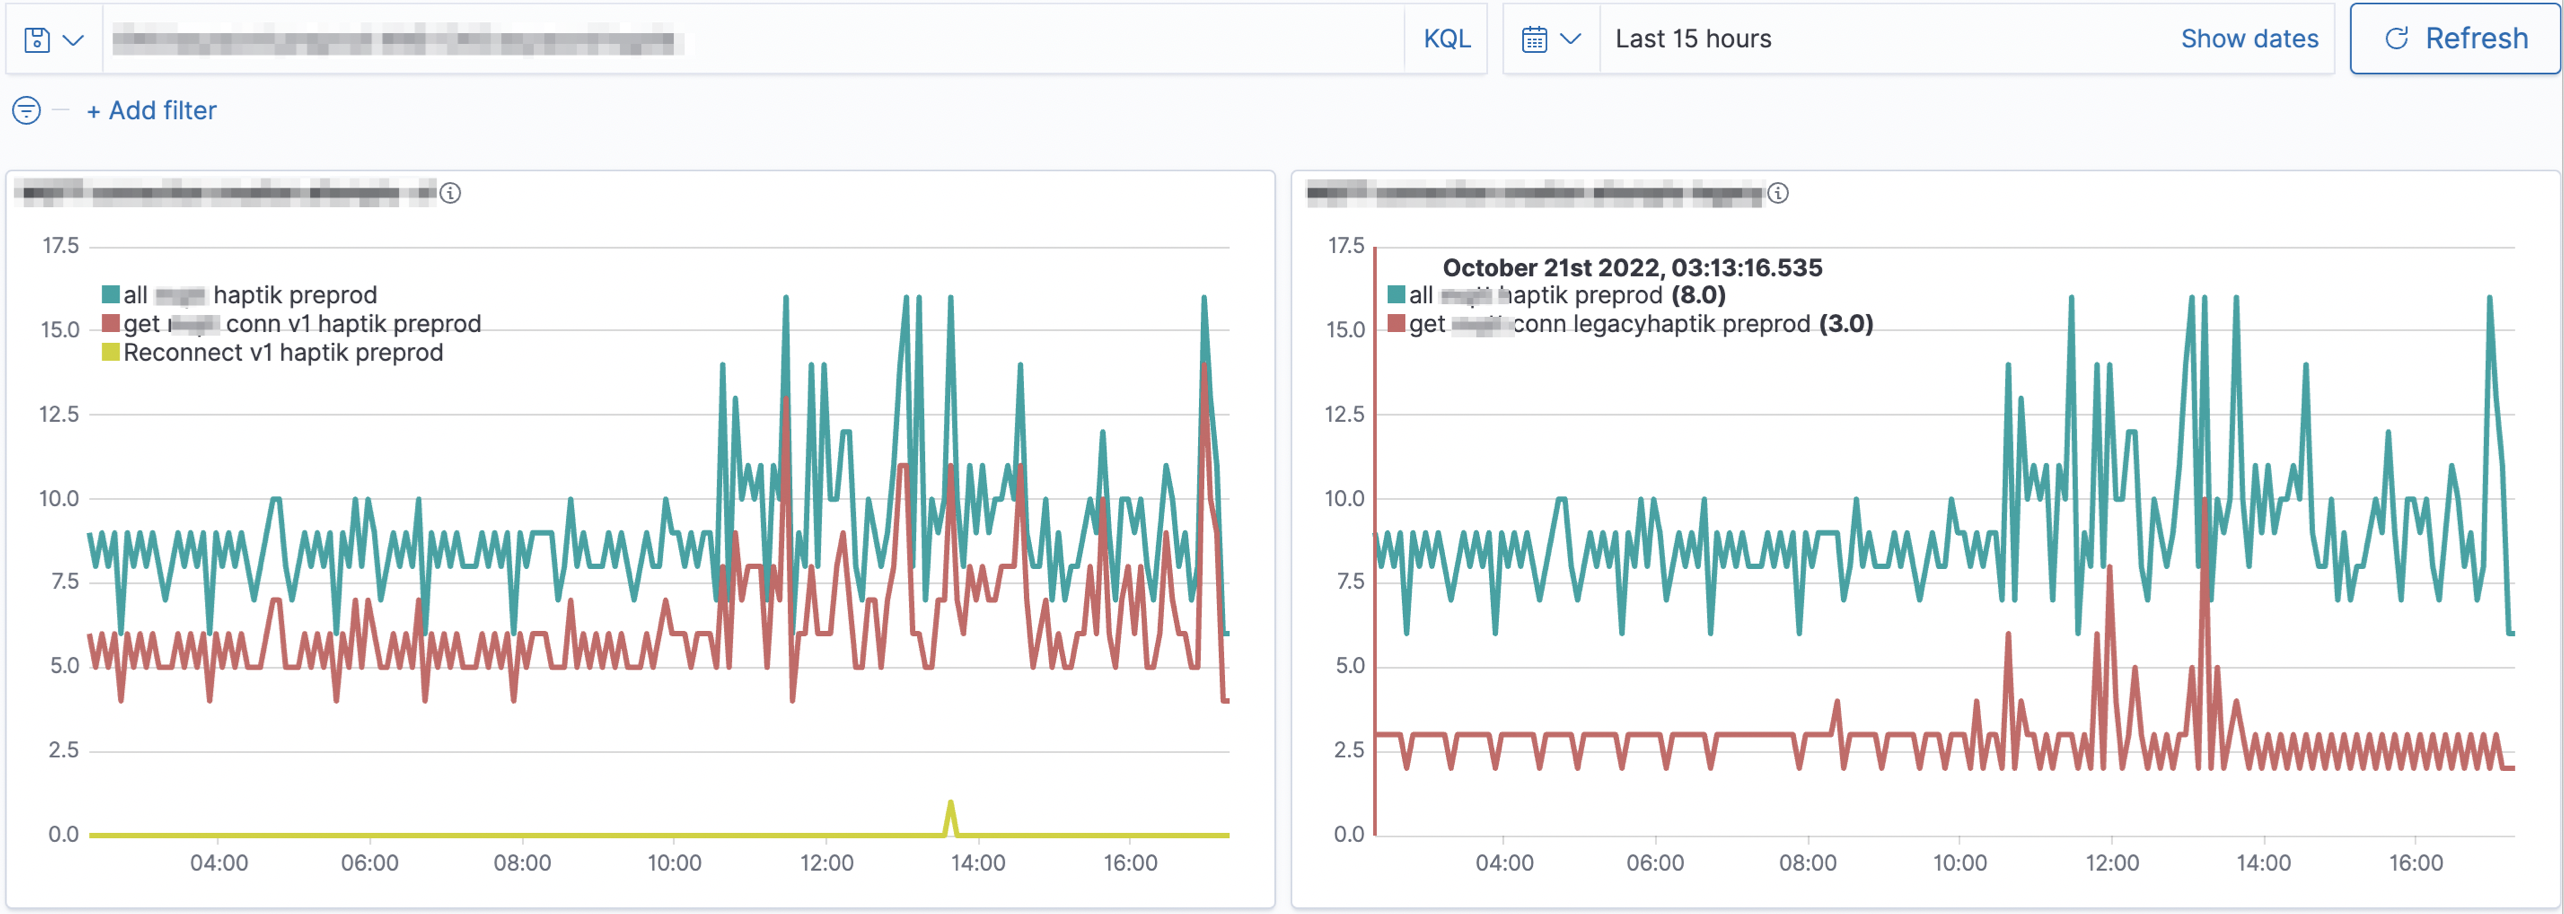
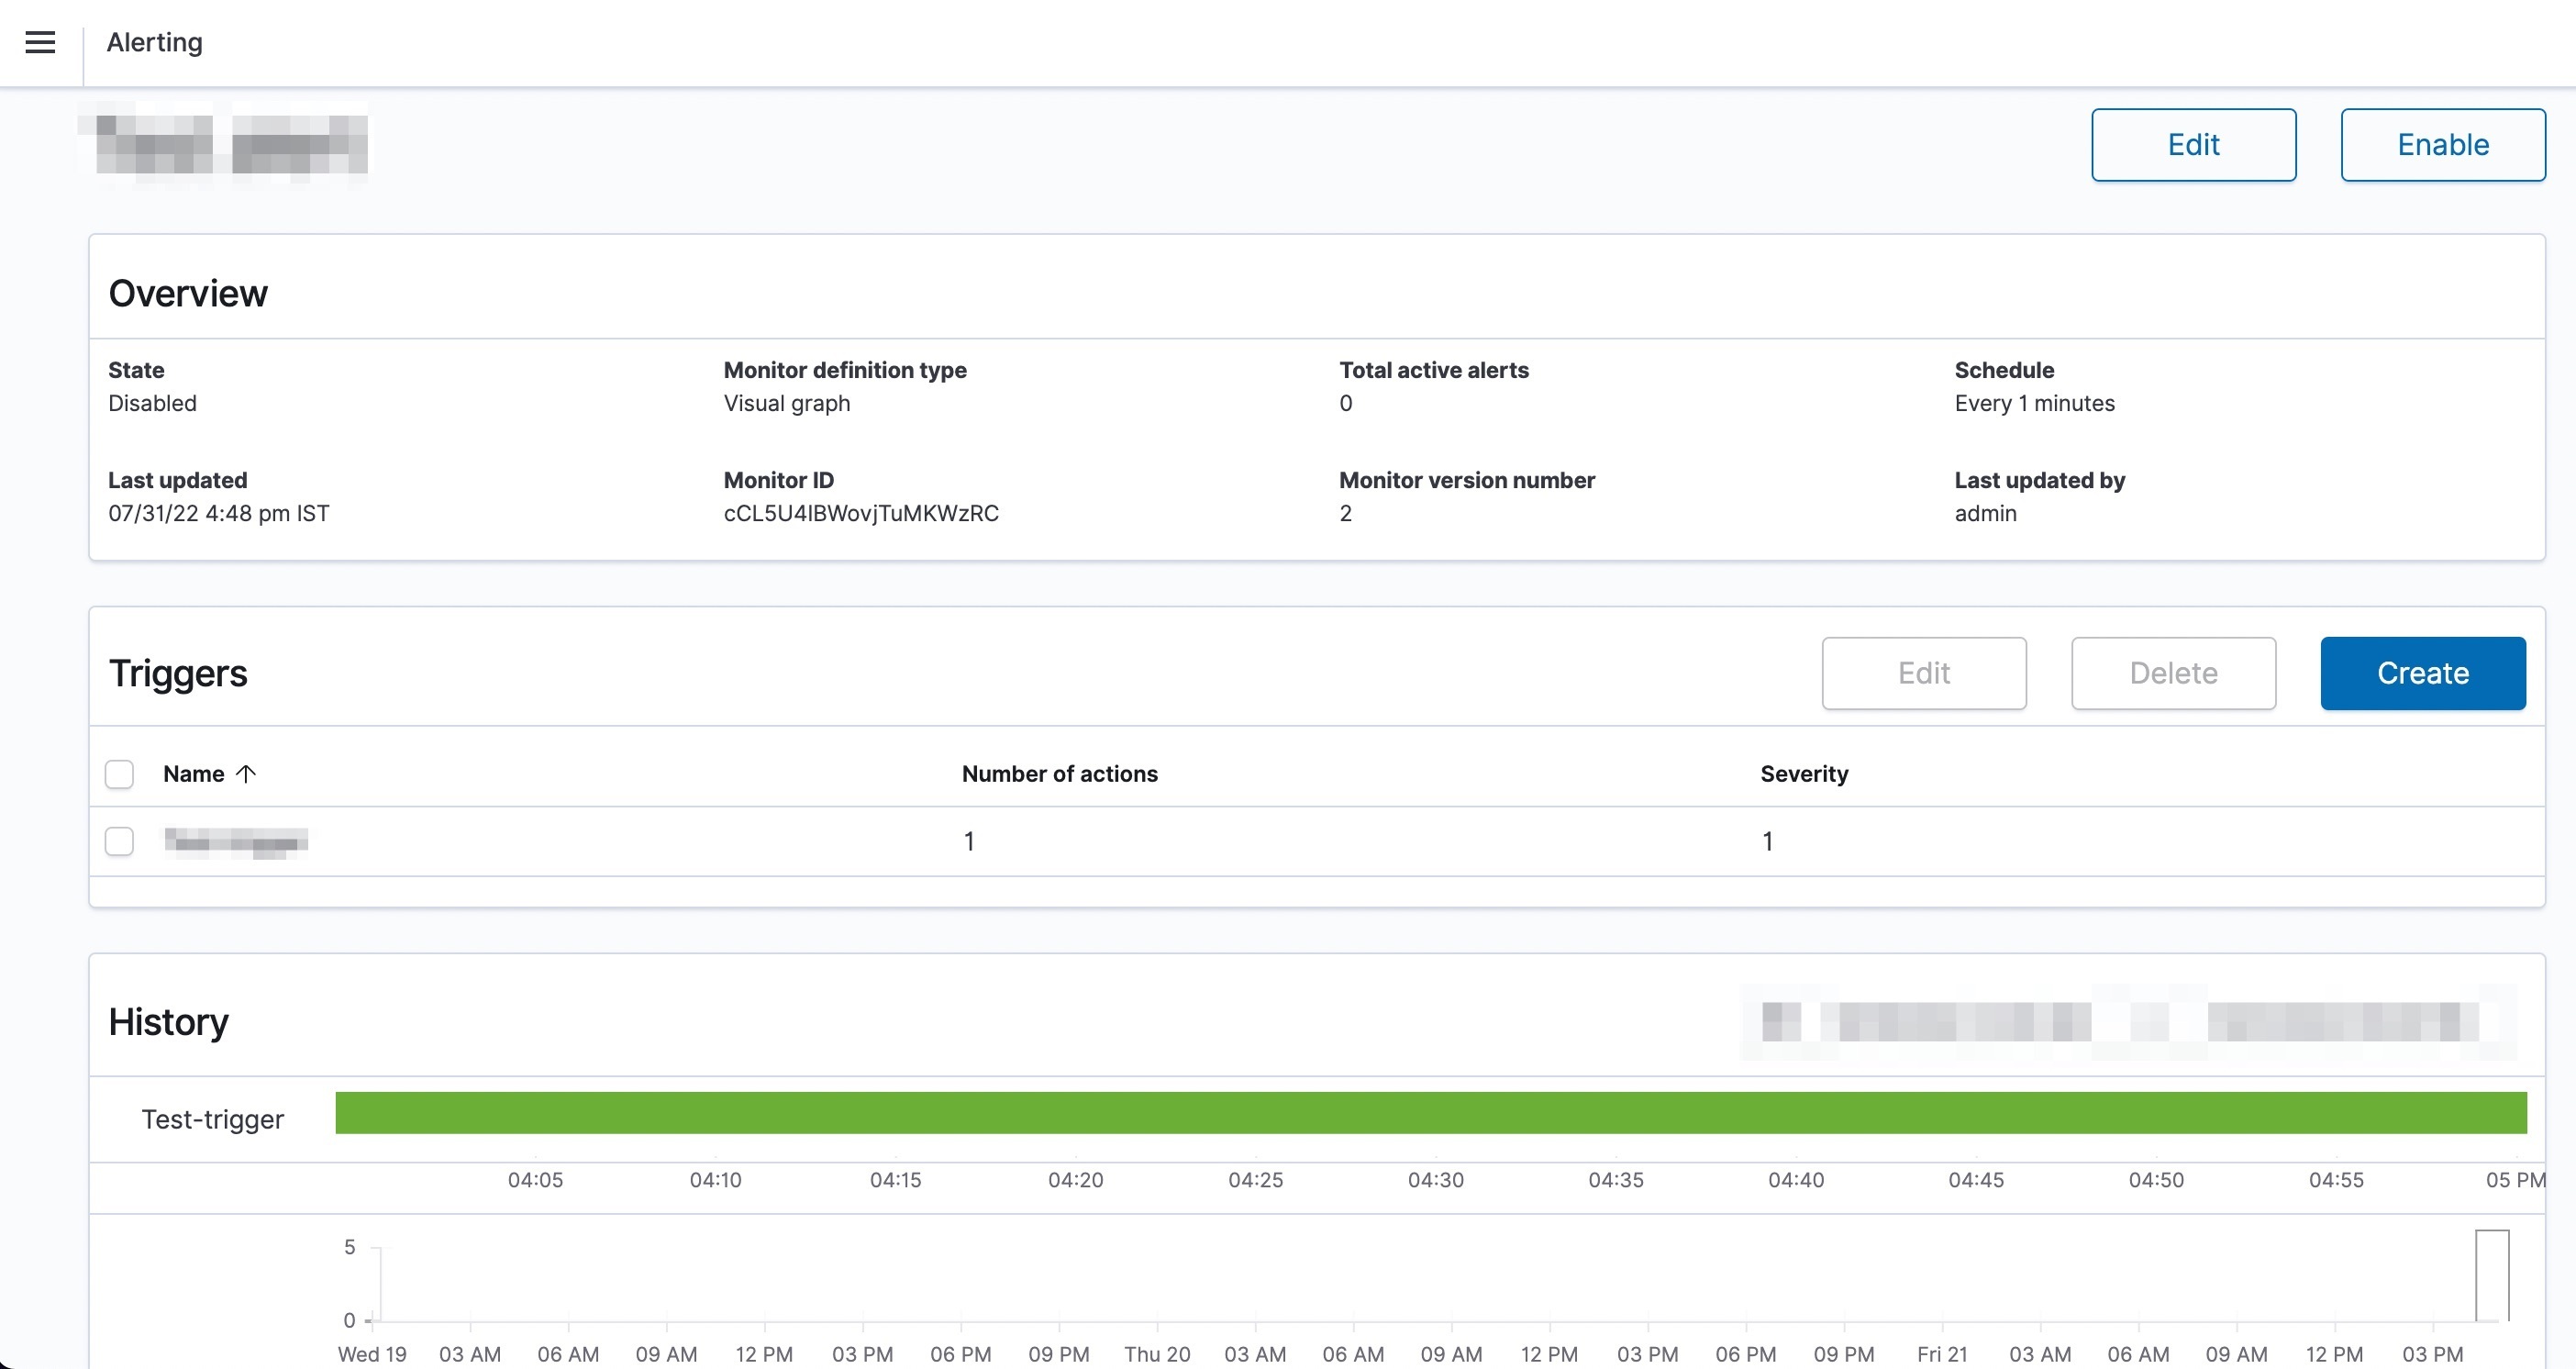
Since logs are now centralized, alerts on these logs are also set using Open distro Kibana’s alerting feature, which integrates with Slack, Email, Pagerduty, or any custom webhooks.
This framework is followed for all of our products & its services. We continue to innovate and put in place robust systems for enhanced security, troubleshooting and productivity of engineers. Follow our blog more such informative content.


.webp?width=352&name=Charles-Proxy%20(1).webp)


source on Google